The Geography of Pokémon GO: Beneficial and Problematic Effects on Places and Movement

summary
Mixed-methods study uses a geostatistical analysis of PokéStop density (Ingress-sourced portals) and a field survey of 375 players across five countries during July–August 2016. Key findings: urban counties have 97× more PokéStops per km² (2.9 vs 0.03), demographically white areas have far higher densities, 60% visited new locations, 46% spend money while playing, and 70% play in groups (mean size 2.7). Reported harms are mostly movement-related (one-third bumping into objects, 11% traffic issues; only one crime report). Design fixes include adding stops in underserved areas or balancing item drops by local density.
AI-written summary · about
chapters (7)
- 0:00Introduction to study
- 1:58Research questions and motivation
- 3:03Study design details
- 6:36Results on place advantages
- 10:30Movement changes findings
- 14:21Design implications and biases
- 16:07Conclusion and Q&A
related talks
 14mLearn about your audience: Mobile gamer insights
 18mData and the City
 21mEngaging players for the long-term
 05mA Data-Driven, Player-Centric Approach to Evaluating Spatial Skill Training Games
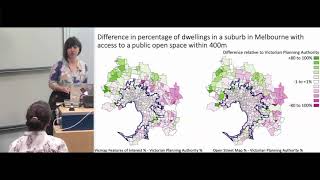 13mDoes our choice of open data sets matter...
 15mData-Driven Cities
 14mGrowth of Location
 08m"More than just a game, it’s an app that builds awareness around Mental Health": Mental Health St...