The Untruthful Art - Five Ways of Misrepresenting Data

summary
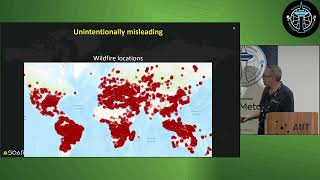
Five concrete tricks are exposed: manipulated axes and missing labels that stretch trends, Power BI visuals reshaped to hide raw data, selective time windows and cherry-picking (Fox News job-loss and UK debt examples), misleading comparisons and maps that ignore population (2012 US map, Chicago vs Baltimore murders), false causation (glyphosate, vaccines, spurious cheese correlations), cumulative charts that mask drops, and outright deceptive artifice (Reuters Florida gun chart, altered scales in UK COVID reports).
AI-written summary · about
chapters (8)
- 0:00Data manipulation risks
- 3:04Session overview
- 13:12Misleading axes
- 25:50Bad visual comparisons
- 33:00Correlation vs causation
- 41:26Spatial data deception
- 46:00Power and danger of visuals
- 48:30Call to action