Feature Speaker
summary
Argues that modern infographics descend from maps and Playfair’s 18th‑century invention of line, bar and pie charts and shows concrete examples and methods: a birthdays heatmap that reveals a September birth spike, a Civil War county map of slave counts Abraham Lincoln repeatedly consults, Twitter geotag analysis used to build Twitter geotag maps of dialect and beer preferences, a National Geographic 77‑million‑year coastal reconstruction, and a New York Times 3D climbing path. Links the effectiveness to fast visual processing, calling it pre-attentive vision.
AI-written summary · about
chapters (37)
- 0:00Introduction
- 2:51History
- 3:12Southern States Map
- 5:09Lincoln Map
- 6:16Oldest Map
- 6:27Stone Map
- 7:56Road Map
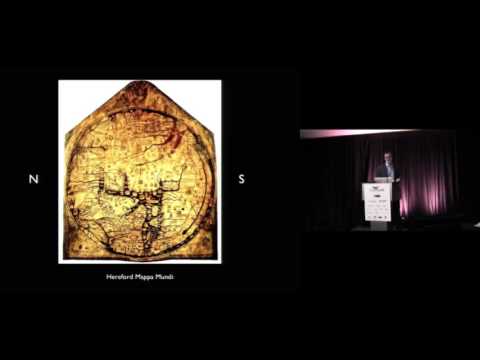
- 8:08World Map
- 8:31William Playfair
- 11:34The Human Brain
- 13:44Birthdays
- 14:00Applied Neuroscience
- 14:19Technology
- 14:46Map Making
- 15:24Information Overload
- 16:37Printing Press
- 17:06Books Everywhere
- 18:39Book Series
- 19:54Bro Map
- 21:28United States
- 22:20Beer Space
- 22:45Language
- 24:02Map
- 26:09Recipe book
- 26:41National Geographic
- 27:47spurious correlations
- 29:24infographics are just another medium
- 30:45a master of storytelling
- 31:43stagemanaging infographics
- 31:55New York Times example
- 33:36Best American infographics
- 34:24Emily
- 36:52Wendy
- 38:09Paige
- 39:15Is infographics dead
- 41:37Infographics vs data visualization
- 42:18What is the purpose of your story
related talks
 05mThe Art of Data Visualization
 11mWarmup - From Print to Screen
 08mKeynote Speaker
 26m"Where Numbers Meet Art: Building Data Visualizations In The Modern Web"
 14mStorytelling in the Age of Big Data
 10mThe Future of Data Visualization
 21mVisualizing data with JavaScript at Twitter
 11mData Visualization & Storytelling