Performance lab. The power of the perf tool!
summary
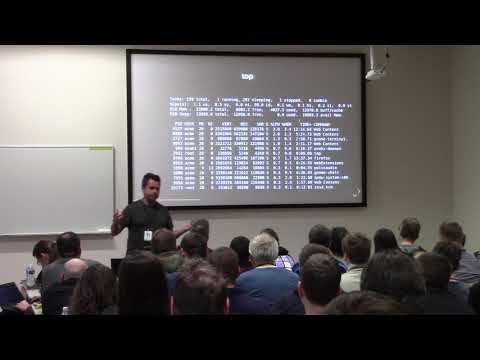
Demonstrates using perf to find real issues: counts and samples CPUs, PMU power events, and SMIs (one generated by pressing the mute button), builds perf from source, and creates probes with perf probe and BPF uprobes. Uses perf record/archive to share profiles and runs perf c2c to locate cache-line contention in PostgreSQL, applies a patch that separates a lock to a new cache line and gains ~4% throughput. Shows perf top/stat/trace workflows and integration with BPF for low-overhead tracing. perf c2c perf probe perf archive
AI-written summary · about
chapters (32)
- 0:00Introduction
- 1:40Count things
- 3:06Other events
- 3:38SMI
- 5:43Perfect
- 7:31Shell completion
- 7:53PMU
- 8:36Top
- 8:56Kernel
- 9:26PerfectOp
- 12:07GDB
- 12:36Perf
- 15:00Source code
- 15:59Adding probes
- 17:31Adding strays
- 18:05Perface overhead
- 19:00Ring buffer
- 19:56mitosis calls
- 21:49asset tools per
- 22:39regression test
- 24:12perf tool
- 25:41C2C example
- 28:09Record data
- 29:30Make data available
- 30:41C2C
- 33:30Cache line
- 35:32Source
- 37:26Cache structure
- 38:25Fixing cache structure
- 39:05Modifying data
- 39:42Results
- 40:34Questions
related talks
 59mBeyond pprof, Hardware Performance Counters
 45mLinux perf tool metrics
 24mlibperf: library for perf events monitoring
 45mPerf tools updates and beyond
 45mFast and Safe Production Monitoring of JVM Applications with BPF Magic
 45mThe perf Profiler and the JVM (Part 1)
 48mProfiling data structures
 31mFantastic tracepoints and where to find them