The Shape of Uncertainty

summary
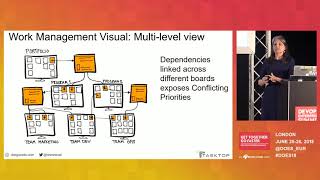
Uses LeanKit and a Kanban Flow method to turn lead times into probabilities by plotting flow times and percentiles, not guesses. She shows a 10-item sample where 50th = 4d 70th = 8d 90th = 14d, maps the scatter to a long‑tailed histogram (hundreds done <1d, ~15 items ≥90d), and demonstrates that dependencies cut delivery odds (2 deps → 25%, 3 → 12.5%, 7 → <1%). Recommends queue size = leading indicator, setting WIP limits and reserving capacity to raise on‑time probability.
AI-written summary · about
chapters (13)
- 0:00Intro
- 0:48Cascadia Subduction Zone
- 2:42Metrics
- 3:33Pipeline
- 11:55Time Series Plot
- 13:55Histogram
- 14:29Shape of Distribution
- 17:36Scatterplot
- 18:44Unplanned Work
- 20:21Decision Making
- 21:07Takeaways
- 22:03Question
- 22:37References
related talks
 41mThe Development Metrics You Should Use (but Don’t)
 16mPractically predictable – Forecasting delivery when nothing is certai
 36mThe Development Metrics You Should Use (but Don’t)
 05mNo estimates? Try Flow Metrics.
 43mPredictable Delivery
 49mThe Development Metrics You Should Use (but Don’t)
 44mAgile metrics for predicting the future
 30mHow to Visualize Impacts to Your Workflow & Metrics