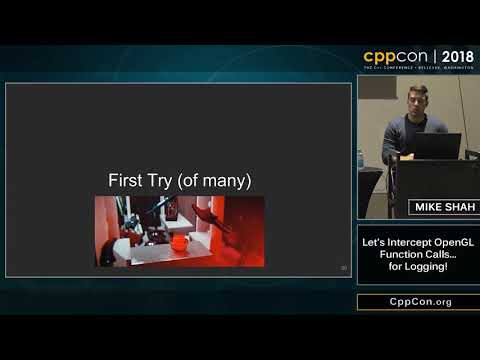
Let's Intercept OpenGL Function Calls...for Logging!
summary
A working OpenGL logger is built that records 100% of API calls by interposing or injecting code and writing compact traces; strategies include simple printf/macros, a LLVM function-pass for source rewriting, compile-time interposition or LD_PRELOAD, and dynamic tools like Intel Pin or ptrace attach. Data is written as integers via a hashmap, buffered with ring buffers to avoid stalls. Demo logs per-frame call counts, exposes redundant glEnable calls and high glDrawArrays frequency, and trades accuracy for runtime overhead.
AI-written summary · about
chapters (14)
- 0:00Introduction and welcome
- 1:50Goals for the OpenGL Logger
- 2:52What is OpenGL and why log
- 5:32Strategies for dynamic analysis
- 8:04Logging 100% of OpenGL calls
- 9:12First try with printf logging
- 11:04LLVM function-level instrumentation
- 15:49Storing logged data efficiently
- 20:08Logging without source code
- 20:53Dynamic binary instrumentation with Pin
- 24:40Ptrace for lightweight logging
- 26:30Additional instrumentation tools
- 27:14Homework and next steps
- 28:37Results and closing
related talks
 06mPrintf Debugging at 1ns: High-Performance C++ Logging Without Locks
 01h 05mHow to Write a Heap Memory Profiler
 06muftrace: A function graph tracer for C/C++ userspace programs
 51mAutomation Techniques in C++ Reverse Engineering
 57mModern Linux C++ debugging tools - under the covers
 11mHeaptrack: A Heap Memory Profiler for Linux
 01h 29mModern Linux C++ Debugging Tools - Under the Covers
 01h 26mBoost your C/C++ Developer's Debugging Powers with GDB