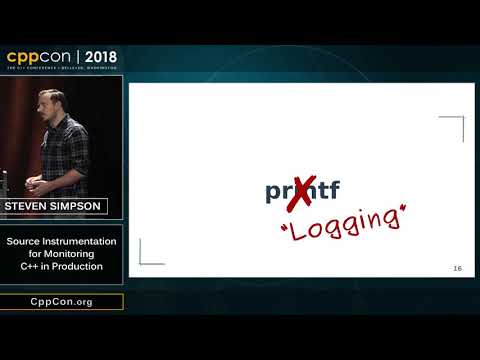
“Source Instrumentation for Monitoring C++ in Production”
summary
Advocates adding source instrumentation into production builds so logs become structured logging rather than human-only text, emitting traces on operation end with start timestamp or duration, linking nested operations by IDs, and using atomic counters sampled or polled (typical scrape every 5s) to keep hot-loop overhead tiny. Recommends sampling, aggregation, binary trace formats, and existing tools: Prometheus metrics for counters and OpenTracing/Jaeger for distributed traces; shows these techniques scale across processes and languages and reduce firefighting time.
AI-written summary · about
chapters (26)
- 0:00Intro
- 8:35Logging
- 15:20Structured Data
- 17:45Tracing
- 18:40STrace
- 19:58Logging in
- 21:37Output
- 22:40Trace Relationships
- 27:39Overheads
- 31:23Top
- 32:30Memory Usage
- 33:22System Metrics
- 34:19Open Metrics
- 36:21Count
- 37:19Collection
- 39:04Counting
- 40:24Processing Data
- 40:57Visualization
- 44:14Metrics
- 45:30Coffee
- 48:37Questions
- 48:53Metrics tracing libraries
- 51:14Crosslanguage tracing
- 52:53Intel TVB
- 53:20Prometheus
- 57:50Summary
related talks
 53mSource Instrumentation for Monitoring C++ in Production
 42mFounder/CTO Perspectives: The Future of Distributed Tracing
 06mIgnite | Discovering the Magic Behind OpenTelemetry Instrumentation
 27mInstrumenting at 10 years per second
 31mObservability for Developers: How to Get There
 42mObservable Applications Using OpenTelemetry
 31mDiscovering the Magic Behind OpenTelemetry Instrumentation
 40mContinuous Profiling, the missing piece in your observability puzzle!