“How C++ Debuggers Work”
summary
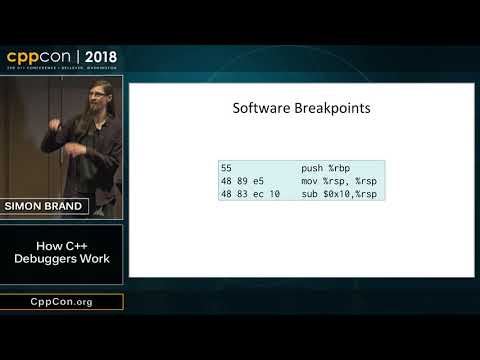
Covers how Linux x86_64 debuggers inspect ELF and DWARF to map source to addresses, uses ptrace + int3 to implement software breakpoints by replacing a byte with 0xCC then restoring and single‑stepping (or using displaced stepping to avoid races), reads/writes registers and memory via ptrace or process_vm_readv, unwinds stacks from frame pointers and DWARF/CIE data, evaluates expressions by generating IR or injecting mmap'ed code, tracks shared libraries via r_debug/link_map, and speaks the gdb remote protocol to a debug stub.
AI-written summary · about
chapters (19)
- 0:00Introduction to debuggers
- 1:06Debugger overview
- 3:50Binary and debug formats
- 7:13Ptrace interface
- 8:20Hardware and software breakpoints
- 11:48Software breakpoint mechanism
- 14:10Debugger interaction
- 17:33Restoring breakpoints
- 22:43Source-level breakpoints
- 26:05Stepping through code
- 29:00Memory and register access
- 30:53Stack unwinding
- 33:52Expression evaluation
- 37:05Advanced expression evaluation
- 43:33Multi-threaded debugging
- 45:46Shared library tracing
- 48:51Remote debugging
- 51:14Remote protocol details
- 52:15Q&A and final topics
related talks
 01h 15mReliable Stack Traces, the Reality of Myth
 33mInternal Architecture of Delve, a Debugger For Go
 26mServiceable Runtimes
 23mAn In-Depth Analysis of Disassembly on Full-Scale x86/x64 Binaries
 25mSource-level debugging of compiler-optimised code: ill-posed, but not impossible
 01h 00mFrom Program to Process - What Happens After the Compiler
 01h 04mCompiler Bugs And Bug Compilers
 01mTalk Preview: How Symbols Work and Why We Need Them