Profiling Node Applications

summary
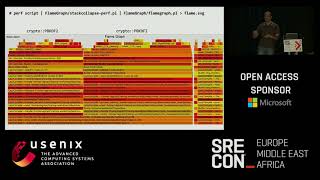
Profiling Node in production distinguishes concrete root causes: V8’s --prof requires starting Node with a flag, while perf can attach live but needs a perf map; BCC/BPF aggregates in-kernel so you avoid huge logs (the demo shows ~19 MB/s of perf output). Concrete findings include a hotspot where pbkdf2_sync consumes ~93.5% of C++ time and raises median latency to ~1.1s, and a writeFileSync that blocks the event loop revealed by off‑CPU flame graphs.
AI-written summary · about
chapters (11)
- 0:00Start
- 3:32A Mind The Overhead
- 4:44Sampling vs. Tracing
- 5:56Tools And Operating Systems Supported
- 6:54Demo: The V8 Profiler
- 24:48Flame Graphs
- 25:23Reading a Flame Graph
- 28:39Demo: Generating A Flame Graph
- 29:38What's Wrong With perf?
- 37:52Demo: Off-CPU Profiling With BCC
- 48:37Demo: Identifying Excessive GC
related talks
 29mProfiling Node Applications
 45mSpeeding Up Node Apps: When the Standard Profiler Isn't Enough
 50mDebugging Node.js in Production
 25mNode js applications diagnostics under the hood
 01h 04mNode.js performance analytics and best practices
 28mPerformance Profiling for V8
 01h 12mA New Way to Profile Async Activity in Node.js
 49mA Journey into Node.js Internals