Crash course in Kubernetes monitoring

summary
Shows a working stack: Prometheus for scrape-based time-series storage, Grafana dashboards provisioned via Helm, and exporters like node_exporter plus kube-state-metrics. Explains counters, gauges and histograms, how to annotate pods vs use ServiceMonitor CRDs, and how alerts route to Slack/PagerDuty. Demonstrates aggregations (rate, sum by host) and a small custom Dropwizard-to-Prometheus servlet (~50 lines). Notes Prometheus data is persisted by default in the Helm chart; Grafana dashboards require explicit provisioning.
AI-written summary · about
chapters (14)
- 0:00Intro
- 0:42Outline
- 2:40What are metrics?
- 4:10Monitoring architecture
- 6:11Drop Wizard Metrics - Recording
- 8:52Getting data into Prometheus - metrics endpoint
- 11:48Prometheus queries
- 14:34Prometheus alerting
- 16:38Grafana panels
- 19:34Annotations
- 20:27Service Monitor
- 22:17Kube state metrics
- 22:52Prometheus exporters summary
- 23:51Monitoring setup
related talks
 24mPractical Kubernetes Monitoring with Prometheus
 19mKeynote: Monitoring Kubernetes Clusters with Prometheus
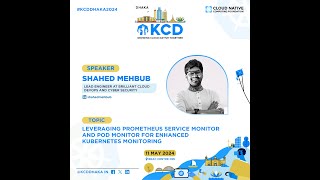 46mLeveraging Prometheus Service Monitor and Pod Monitor for Enhanced Kubernetes Monitoring
 37mMonitoring Kubernetes with Prometheus
 37mKubernetes, Monitoring with Prometheus and Grafana
 02h 43mPrometheus from A to Z
 32mDemocratizing Application Monitoring with Prometheus
 14mFrom Metrics to Mastery: Monitoring vital signs of Kubernetes