Auto-instrumentation for GPU performance using eBPF
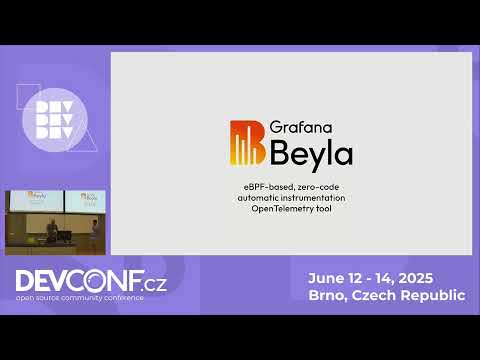
summary
Prototype uses eBPF probes on CUDA libcalls to capture kernel launches, host↔device memory copies and allocations at the CPU side, then exposes those events as Prometheus-exported kernel launch and memcpy metrics for Grafana. Implementation runs with minimal CPU overhead, is framework-agnostic for CUDA, open-source on GitHub, and shows per-container/kernel cardinality and memory-copy patterns. Limitations: no GPU-internal stats or per-kernel execution time and stack unwinding is partial when frame pointers are optimized away.
AI-written summary · about
chapters (13)
- 0:00GPU monitoring with eBPF
- 1:25Startup GPU struggles
- 3:59GPU failure risks
- 6:06Current tool limitations
- 9:58Grafana Beyla intro
- 10:41Zero-instrumentation tracking
- 13:39CUDA kernel costs
- 16:14GPU metrics in Prometheus
- 17:42GPU memory patterns
- 20:15GPU stack traces
- 21:38eBPF GPU limits
- 22:42GPU vs modern monitoring
- 24:02Q&A
related talks
 28mAuto-instrumentation for GPU Performance Using eBPF
 21mAuto-Instrumentation for GPU Performance using eBPF
 33mAuto-instrumentation of Prometheus for RED Monitorin...
 42meBPF-Powered Observab...
 31mZero instrumentation observability with eBPF
 29mUsing eBPF for Non-invasive, Performant, Instant Network Monitoring
 36mPrometheus as exposition format for eBPF programs ..
 35mSidecarless Mesh Monitoring with eBPF and Grafana