Writing a Java Profiler in Pure Java

summary
A working Java sampler runs concurrently inside the JVM, collects stack traces via Thread.getAllStackTraces, aggregates them into a compact tree and emits flame graphs; a usable prototype fits in 240 lines of pure Java and users report 2–5% overhead depending on settings. Typical fixes shown include switching JSON file I/O to SQLite which eliminated the main-loop stall. Demos cover async-profiler, JFR/JDK Flight Recorder and an IntelliJ JFR plugin that links recorded events to source lines.
AI-written summary · about
chapters (20)
- 0:00Introduction
- 3:06What profiling is
- 6:15Who am I and why write a profiler
- 8:03Instrumenting vs sampling
- 9:28Building a Java profiler
- 11:36Java agents and JVM
- 13:00Sampling stack traces
- 14:25Flame graphs from traces
- 16:09Existing profiling tools
- 17:33Async profiler API
- 19:23Profiler risks
- 20:50Async profiler config
- 21:52Java Flight Recorder
- 23:21Custom JFR events
- 25:10Analyzing profiles with JMC
- 27:16JFR plugin for IntelliJ
- 28:45Sampling limitations
- 29:29Profiling performance impact
- 30:34Continuous profiling tools
- 32:03Key takeaways
related talks
 42mWrite your own Java Profiler in 240 lines of pure Java
 41mUnleash the Power of Open-Source Java Profilers
 46mCPU Profiling on the JVM and Flame Graphs
 51mThe Power of JDK Flight Recorder: Efficient Profiling and Troubleshooting for Java Applications
 39mFive most useful profiling techniques to use with modern Java apps
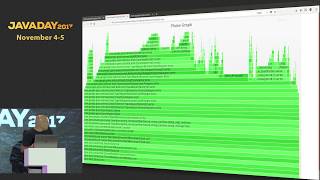 52mProfilers Are Lying Hobbitses
 45mJava Performance Analysis and Optimization
 42mProfiling and monitoring with the JDK