The Power of JDK Flight Recorder: Efficient Profiling and Troubleshooting for Java Applications
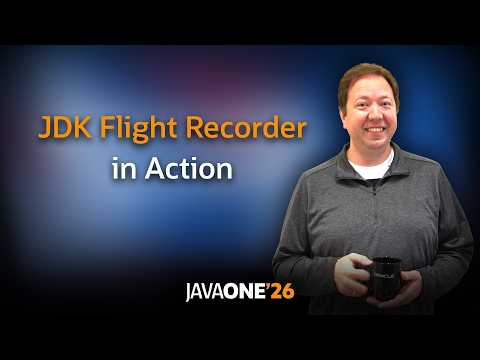
summary
JDK Flight Recorder records JVM events into compact, self-describing recordings with less than 1% overhead and efficient stack traces; recordings start via -XX:StartFlightRecording or on-running with JCMD/JFR tools. Demos show hot‑method aggregation (one method uses ~30% CPU), GC pause analysis (max ~206 ms, resolved by switching to ZGC), and a memory‑leak trace pinpointing a hashmap holding 2 million entries caused by missing equals/hashCode. API and JMX/streaming hooks let code or fleet tooling dump or analyze recordings when needed.
AI-written summary · about
chapters (21)
- 0:00JDK Flight Recorder intro
- 1:02Origins and purpose
- 3:08Key features and design
- 4:55Understanding JFR events
- 7:22Built-in JDK events
- 9:06Filtering and config
- 11:55Start recordings in prod
- 16:32Command-line tool demonstration
- 19:41Live recordings with JCMD
- 22:13Q&A on recordings
- 24:01Safe point bias concerns
- 27:31Virtual threads support
- 28:58Real-world troubleshooting
- 31:26Latency with GC pauses
- 34:12Memory leak detection
- 39:52Diagnosing unresponsive apps
- 41:37Health monitoring agents
- 42:19JMX recording control
- 43:43Event streaming APIs
- 45:28Scaling JFR for fleets
- 46:55Summary and resources
related talks
 39mProgrammer's Guide to JDK Flight Recorder
 45mAnalyzing Safe Flights, and Firey Wrecks with JDK Flight Recorder
 46mContinuous Monitoring with JDK Flight Recorder
 42mContinuous Monitoring with JDK Flight Recorder
 42mProfiling and monitoring with the JDK
 56mTaking Off With #JDK #FlightRecorder
 37mProgrammer's Guide to JDK Flight Recorder
 01h 09mContinuous Monitoring With JDK Flight Recorder (JFR)