Five most useful profiling techniques to use with modern Java apps

summary
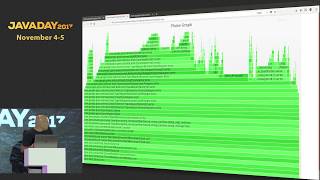
Five concrete techniques with tools and outcomes: use VisualVM to intercept JDBC calls and copy exact SQL to spot N+1 queries (example shows 10 identical DB calls), use a profiler with flame graphs to find CPU hotspots, use JProfiler call graphs to trace framework call chains, analyze heap snapshots to find whether memory growth is a leak or a GC bug (one case was a 5s stall caused by a remote HTTP call via httpbin), and for reactive apps prefer full sampling vs profiling guidance: start with profiling, not sampling.
AI-written summary · about
chapters (10)
- 0:00Intro
- 2:08Who am I
- 3:03Profiling
- 6:44Hibernate
- 10:03Demo
- 17:34Finding Hotspots
- 22:06Sampling
- 27:40Call graphs
- 32:20Memory usage
- 35:28Profiling reactive apps
related talks
 41mUnleash the Power of Open-Source Java Profilers
 46mJava Deep Dive - the ins and outs of profiling
 33mWriting a Java Profiler in Pure Java
 45mMastering JVM Profiling: Advanced Techniques and Real-Life Case Studies
 46mCPU Profiling on the JVM and Flame Graphs
 56mJava Performance Analysis
 52mProfilers Are Lying Hobbitses
 01h 28mThe dark art of performance tuning or how to become a performance hero ...