JVM Profiling under the Hood
summary
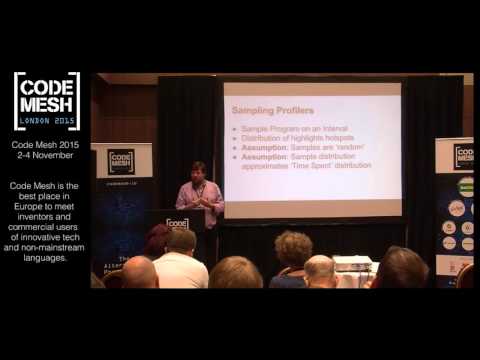
Profiling claim is that sampling reveals hotspots but default JVM TI safepoint sampling hides them and can massively mislead developers, for example 63% misattribution to a wrapper method under JVisualVM while an alternative using async_get_call_trace via SIGPROF and a lockfree ring buffer shows the real work as 93% in execute. An open source profiler is built that logs samples off-thread and it works though it exposes issues like a memset bug in signal handler, and alternatives like perf Java Mission Control and Azul Zing offer different tradeoffs.
AI-written summary · about
chapters (25)
- 0:00Introduction
- 0:48Millennium footbridge
- 1:49Structure
- 3:14Application Profiling
- 5:30Performance Problems
- 6:04Profiling Problems
- 6:31Instrumentation Profiling
- 8:54Sample Time Distribution
- 10:13Periodicity Bias
- 11:59Bias
- 15:14The Problem
- 15:56The JVM TI
- 16:36Safe Points
- 20:37Time to Safe Point
- 23:09Alternative sampling methodology
- 24:45Async getcalltrace
- 25:52sigprof
- 26:53signal
- 27:25how does it work
- 28:41limitations
- 30:22sleeping threads
- 33:42other profiling tools
- 37:52conclusions
- 38:41broader takeaway
- 39:53Questions
related talks
 45mMastering JVM Profiling: Advanced Techniques and Real-Life Case Studies
 50mObservability Beyond the Three Pillars — Continuous Profiling With Alibaba Dragonwell
 46mProfiling your Java Application A Beginner’s Guide
 40mProfiling Without Pain: Always-On Performance for the JVM
 51mProduction Profiling: What, Why and How
 52mThe missing piece in your observability puzzle!
 20mUnderstanding Request Latency with Wallclock Profiling
 47mTracing Java's Hidden Performance Traps