Visualization to the rescue

summary
A consolidated visualization board built on JIRA — the PJF backlog — maps 40 products (30M LOC) and 60 components across seven communities so teams see where 777‑page tenders and 286 requirements stall. Moving framework work into paired customer migration projects cuts lead time from over a year to several months, converts many “bugs” into agreed scope changes, and drops zero escalations to CEO; process shifts include replacing long text specs with backlog items and tighter acceptance gates.
AI-written summary · about
chapters (5)
- 0:00Company and project context
- 3:56Framework and process setup
- 7:32Identifying process issues
- 9:38Visualization as a solution
- 12:30Outcomes and lessons learned
related talks
 47mVisualisation
 30mVisualizing Transformation: 5 Ways to Make Work More Visible
 39mUnblocking Backlog Jams
 38mBreaking Down Silos Between Platform and Product Teams
 16mData Driven VSM for Quality Excellence
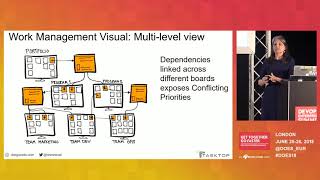 30mHow to Visualize Impacts to Your Workflow & Metrics
 43mPredictable Delivery
 06mSi ta përdorim JIRA për të planifikuar projektet tona