The Hitchhiker's Guide to Ruby GC

summary
Shows that garbage collection, not just databases or algorithms, is the real culprit: a Sinatra app hits about half a million live objects on boot, Ruby 1.9.3 runs 122 GC runs → 66 runs (4.4s → 3s), and switching to Ruby 2.0 (bitmap marking + COW) cuts GC and require time. Case study with Unicorn exposes COW blowup across forks. Remedies: profile (ruby-prof, GC.stat), upgrade Ruby, and cautiously tune malloc_limit (default ~8MB), heap_min_slots and heap_growth_factor (1.8→lower).
AI-written summary · about
chapters (19)
- 0:00Intro
- 0:28The Hitchhiker's
- 3:17Ruby Wizardry RUBY
- 5:38We're talking MRI
- 13:19Wild White Object Appears!
- 13:49Write Barriers
- 15:15GC Tuning
- 21:57The RValue
- 23:09Heaps on Heaps (1.9.3)
- 24:33The Free List
- 24:46Copy on Write When our production processes call fork, the new child process shares all memory with the parent
- 26:19Memory in Ruby 2.0
- 26:47Bitmap Marking
- 28:00Upgraded to 2.0 • Leveraged copy on write
- 28:37Profiled
- 29:21Tuned the GC
- 30:31Credits && Further Reading
- 31:48Turning it to 11
- 33:54Questions?
related talks
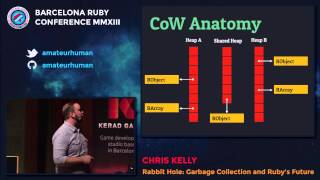 49mRabbit Hole: Garbage Collection and Ruby's Future
 42mTweaking Ruby GC Parameters for Fun, Speed, and Profit
 21mUnderstanding Garbage Collection in Ruby
 34mUnder the Hood of Ruby's Generational Garbage Collector
 33mRails and the Ruby Garbage Collector: How to Speed Up Your Rails App
 24mRuby Performance Secrets and How to Uncover Them
 42mDebugging Ruby
 38mFinding a needle in the haystack - Debugging performance issues