Ruby Memory Management Hacks
summary
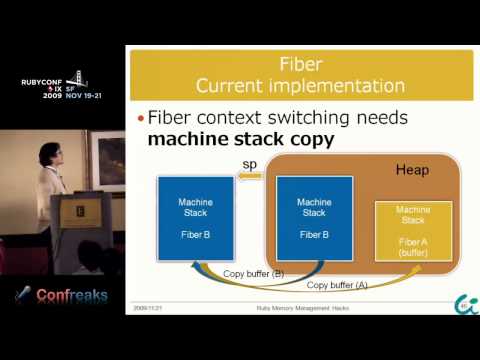
Describes concrete hacks: an OBspace memory profiler that reports per-type memorysize and enables sampling profiles, a change to inline cache and node object handling that cuts garbage collection frequency, OS page aligned allocation to reduce fragmentation, an instruction set tweak that speeds instance variable access, fiber context switch optimized via OS getcontext or machine stack copy, measured speedups including about 2× parallel speedup for simple MVM workloads and a sampling profiler with ~30% overhead and experimental implementations that run today.
AI-written summary · about
chapters (20)
- 0:00Start
- 11:32Solution
- 14:36Memory Profiler
- 18:03New T_DATA representation (3)
- 19:20Statistic Profiler
- 19:46Examples (per T_xxx + Stack frame)
- 20:13Examples (per Classes)
- 20:23Examples (NODE)
- 28:50Switching SP with OS features
- 29:14Context switch cost (sec)
- 29:24Context switch cost (speedup ratio)
- 29:59Proc vs. Fiber
- 30:39Fiber generation speed
- 34:45Challenges
- 37:17C Extension
- 38:53Evaluation environment
- 39:04VM creation time
- 39:49Evaluation (ping/pong)
- 40:12Evaluation (symbol ping/pong)
- 40:48Evaluation (parallel execution)
related talks
 39mPointers for Eliminating Heaps of Memory
 33mFixing Performance & Memory problems
 45mClosing Keynote: Analyzing and Reducing Ruby Memory Usage
 46mHalve Your Memory Usage With These 12 Weird Tricks
 33mDecent into Darkness: Understanding Your System's Binary Interface...
 34mHow to optimize Ruby internal.
 29mWhat causes Ruby memory bloat?
 27mOptimizing Ruby's Memory Layout