Closing Keynote: Analyzing and Reducing Ruby Memory Usage
summary
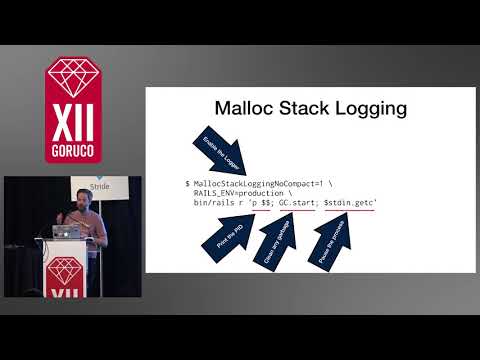
Two C-level patches target real Rails boot pain: a loaded features cache change that uses shared C strings and avoids Ruby string allocations (saves about 4.2% of boot memory on a sample Rails boot), and direct instruction sequence marking that removes the persistent mark array so GC marks bytecode operands directly (cuts object count ~34% and overall process memory ~6%). Findings come from malloc stack logging / malloc_history on macOS plus AllocationTracer/ObjectSpace instrumentation, and land in Ruby 2.6.
AI-written summary · about
chapters (27)
- 0:00Start
- 0:05CLOSING KEYNOTE: ANALYZING AND REDUCING RUBY MEMORY USAGE
- 10:39Malloc Stack Logging
- 11:33Dump Malloc Logs
- 12:07File Contents
- 12:38Reconciling Live Memory
- 13:50Top 20 Allocators
- 17:30Requiring The Same File
- 18:25Cache Generation
- 18:45Cache Structure
- 19:08Generation Algorithm
- 19:22Key Generation
- 22:37Output
- 23:04Malloc Logging
- 26:00Stack VM
- 27:02Processing Phases
- 29:34Optimization Pass
- 30:29Byte Code Translation
- 32:34Hello World
- 34:11VM Implementation
- 35:22Execute 3 Times
- 36:02Object Allocations
- 37:22ISeq Layout
- 41:52Mark Loop
- 42:25Basic Rails App
- 43:25Process Memory: -6%
- 44:17Actual Code
related talks
 39mPointers for Eliminating Heaps of Memory
 51mOpening Day 3 Keynote
 29mWhat causes Ruby memory bloat?
 54mKeynote: Exploring Memory in Ruby - Building a Compacting GC
 29mTidying Active Record Allocations
 43mCat Care and Maintenance
 24mRuby Performance Secrets and How to Uncover Them
 46mRuby Memory Management Hacks