Distributed Request Tracing
summary
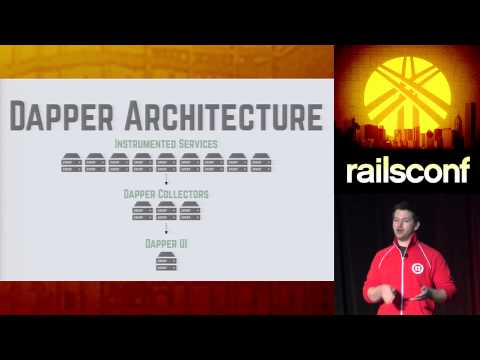
Twilio claims distributed tracing lets engineers follow any request end‑to‑end to find bottlenecks and bad nodes; the talk shows instrumentation using Zipkin with Scribe collectors, finagle/Thrift headers, a Zipkin Tracer Rack middleware and a configurable sample rate so not every request is recorded. A surprising concrete example shows a 500ms DB latency inside a traced span. The demo builds a toy catspammer service wired into Zipkin (SQLite default, MySQL/Postgres/Cassandra backends supported); the trace UI shows spans and annotations, though live SMS delivery fails without network.
AI-written summary · about
chapters (25)
- 0:00Introduction
- 1:37Distributed Request Tracing
- 7:55Cat API
- 8:25Architecture
- 9:45Web Interface
- 11:40Low Overhead
- 12:22Scalable
- 12:48Transparent Instrumentation
- 13:24X Trace
- 14:51Dapper
- 16:53Zipkin
- 18:51Scribe
- 19:50Scribe Interface
- 20:11Instrumenting Rails
- 20:36Installing Zipkin
- 20:56Zipkin Services
- 21:18Ruby Setup
- 22:39Service Configuration
- 23:59Tracing Calls
- 24:35Demo
- 26:23Example Trace
- 26:40Basic Tracing Interface
- 27:01More womp
- 27:15No internet
- 28:13Conclusion
related talks
 42mAn introduction to distributed tracing and Zipkin
 57mDistributed Tracing: How the Pros Debug Concurrent and Distributed Systems
 36mDistributed Tracing: From Theory to Practice
 50mDistributed Tracing in the Wild
 30mDistributed Tracing: From Theory to Practice
 49mDistributed Tracing: How the Pros Debug Concurrent and Distributed Systems
 34mDebugging Your Services with Distributed Tracing
 01h 30mIntroducing CallTracing(tm), based on RabbitMQ, Spring and Zipkin