Debugger Driven Developement with Pry
summary
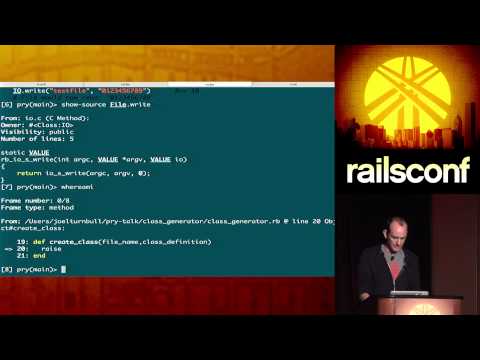
Claims that a debugger can drive development not just fix bugs, and demonstrates it by building a bowling score tracker and getting tests green inside one runtime. Uses Pry plus plugins—pry-rescue, pry-stack_explorer, pry-debugger—invokes runtimes with binding.pry, navigates stack frames, copies history, edits the failing file in place, and replays requests. Shows concrete failures (NameError, NoMethodError, assertion failures), implements class and methods interactively, and validates behavior before persisting code.
AI-written summary · about
chapters (17)
- 0:00Introduction
- 0:34Why Debuggers
- 2:43Pry as an IRB alternative
- 3:12Runtime
- 3:45Enhanced introspection
- 5:59Pry plugins
- 13:14Pry as runtime developer console
- 14:03Traditional workflow
- 17:52Demo
- 18:52Running the code
- 27:17What happened
- 28:05Testing
- 28:23TDD
- 30:13SmallTalk
- 33:25Power of Pry
- 33:44Code Example
- 40:01Conclusion
related talks
 29mFilling the Knowledge Gap: Debugging Edition
 40mDebugging Elixir Code - The Tools, The Mindset
 01h 00mBehaviour Driven Development with RSpec
 21mAbstract Debuggers: Exploring Program Behaviors Using Static Analysis Results
 37mPrying Open The Black Box
 46mBehavior-Driven Development in Python
 37mDebugging Without Borders
 35mMerged PRs: An Untapped Resource for Practice and Exploration