3D geospatial data visualization using Python and Cesiumjs

summary
Processes London TfL GeoJSON with Python + geopandas to produce colored underground-line polygons, then renders 3D buildings and lines on a Cesium globe using CesiumJS and a Cesium ion API token. The demo loads OpenStreetMap 3D tiles (buildings) with just a few lines of code, handles messy file and network hiccups during live processing, and is deployable as a static site (Netlify or GitHub Pages). The visualization works end to end.
AI-written summary · about
chapters (11)
- 0:00Introduction
- 3:12Why 3D geospatial data matters
- 12:30Tutorial goals
- 17:46Processing geospatial data
- 33:13Setting up CesiumJS
- 41:11Building 3D visualization
- 56:04Q&A
- 1:03:19Underground tube lines
- 1:16:33Deployment and next steps
- 1:24:11Indoor mapping challenges
- 1:28:27Summary
related talks
 30mCreating 3D Maps using Python
 30mMaps, Maps, Maps!
 38mBeautiful, Interactive, and Portable Maps using Folium and Live API Data
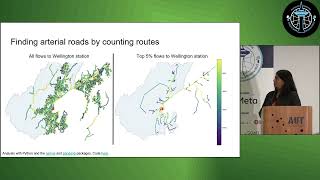 22mUnderstanding our cities with FOSS4G
 01h 34mBuild a Web Map with Open Source Tools
 37mVisualizing Large Datasets with JavaScript Using deck.gl
 46mDiscovering 40 Geo-APIs in 40 Minutes
 01h 41mOpenStreetWhat? Mapping The World With Open Data