Understanding our cities with FOSS4G
summary
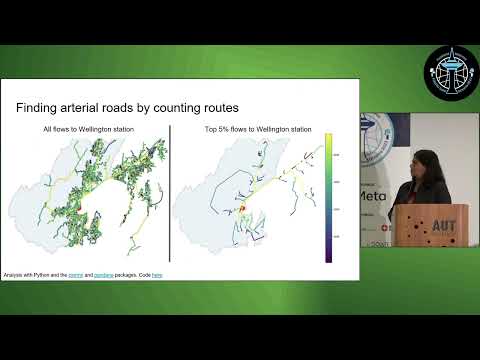
Open-source R and Python workflows use OpenStreetMap and Google Street View to build city analyses: tmap and folium for maps, code on a companion webbook and GitHub, and simple queries to pull building polygons and street networks. Examples include figure–ground diagrams for Mumbai, New York and Islington; routing-derived catchments and isochrone/catchment polygons; a link-usage heatmap showing up to 4,000–5,000 route counts on key streets; and walkability models that add incline to travel time (some suburbs ~30 minutes to nearest playground).
AI-written summary · about
chapters (10)
- 0:00Introduction to FOSS4G for cities
- 1:07From urbanite to urbanist
- 3:19Visualizing urban environments
- 6:28Analyzing point data like cafes
- 8:14Transport networks and routing
- 12:29Walking accessibility in hilly cities
- 14:14Public transport vs car access
- 15:18Building and figure ground analysis
- 17:51Resources and closing
- 18:14Q&A on tools and insights
related talks
 01h 41mOpenStreetWhat? Mapping The World With Open Data
 05mSimplifying access to OpenStreetMap data for urban planning
 50mMaking use of OpenStreetMap data with Python
 16mAdvanced Map Techniques (en)
 13mReimagining Public Transport: An OSM-based Street Supply Tool
 13mUsing open source mapping tools to understand indoor navigation routes...
 22mIsland Mapping: Measuring Urban Footprints with Mapillary & Open Source Tools
 05mSpatial Mapping in Python with GeoPandas and OpenStreetMap