Introduction to Data-Analysis with Pandas
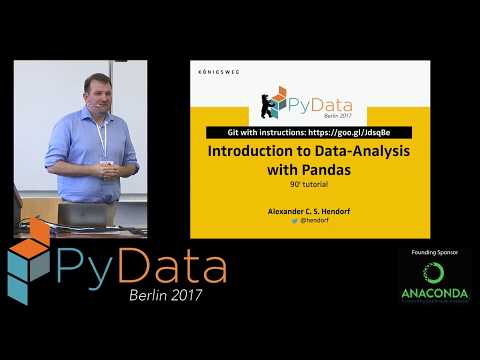
summary
Covers a hands‑on Pandas workflow using Jupyter notebooks and examples that read CSV/Excel/JSON/SQL/HTML via read_csv / to_excel on a ~1,000‑row, 7‑column sample, demonstrates parsing datetimes and the datetime index, explains Series vs DataFrame and index behavior, shows NaN handling with fillna/ inplace and type conversion, builds a turnover column (unit_price units) and runs groupby sum* by product and weekly aggregates, and exports a colorized Excel schedule with XLSWriter — code runs and visualizations render with matplotlib.
AI-written summary · about
chapters (11)
- 0:00Pandas introduction
- 1:29Pandas basics
- 5:09Reading data into DataFrames
- 13:52Datetime data handling
- 25:04Pandas data structures
- 39:16Selecting and slicing data
- 47:32Data manipulation
- 1:00:13New columns and functions
- 1:13:57Handling null values
- 1:21:06Visualization and grouping
- 1:24:13Q&A
related talks
 44mIntroduction to Pandas
 01h 52mIntroduction to data analytics with pandas
 01h 53mAnalyze your data in Python
 25mPandas on Jupyter: Improving Your Data Analysis Workflow
 31mEffective Data Analysis with Pandas Indexes
 36mAutomating Data Analysis with Pandas
 01h 31mPandas, Data Wrangling & Data Science
 01h 21mIntroduction to pandas