Football (soccer) data analysis: A pedagogic introduction

summary
Extracts open StatsBomb data with statsbombpy and mplsoccer, draws pitches, builds directed weighted pass networks and computes centrality and clustering. Pass counts become edge weights (e.g. Casemiro shows 11 outgoing passes), team clustering 0.182 versus 0.276, Toni Kroos posts ~91% pass success, first substitutions at 36:17 and 29:20 cut lineups. Implements NetworkX analysis, convex hulls, Delaunay triangulation and Voronoi zones via SciPy, and renders whether each visual and metric actually matches the match events.
AI-written summary · about
chapters (8)
- 0:00Start
- 1:52Competition's Data Set
- 4:25Draw a Football Pitch Using Mpl Soccer
- 17:42Adjacency Matrix
- 19:41The Average Clustering Coefficient
- 28:37Voronoi Diagrams
- 28:52Voronoi Diagram
- 29:12References
related talks
 11mIntroduction to Soccer Pass Network Analysis with Python
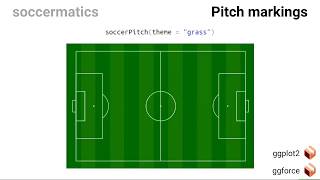 19mFootball Analytics with the Soccermatics Package
 32mCutting Edge Football Analytics in Python
 24mFootbal meets graphs
 32mIdentifying playstyles in football through spatial networks
 45mThe Technical Journey to Define the True Value of a Football Goal
 23mSport analysis with Python
 41mThe evolution of basketball with data science