Footbal meets graphs

summary
Graph model of leagues, matches and teams in Neo4j + cypher quantifies two concrete findings: a measurable home advantage (Barcelona shows ~+0.11 more home wins) and declining league competitiveness over time. Data covers 99 teams, ~20,000 matches, seasons 1993–2009; competitiveness is encoded as directed win-edges with draws as one-point links and measured by connectivity (strong nodes: Real Madrid, Barcelona, Valencia, Man City; weak nodes: Las Palmas, Malaga). Reproducible code uses Docker + neo4r R scripts for queries, tables and network visualizations.
AI-written summary · about
chapters (7)
- 0:00Introduction to football and graphs
- 5:08Neo4j graph database basics
- 11:50Data overview and leagues
- 12:10Home advantage in football
- 16:53Competitiveness in leagues
- 20:51Team strength analysis
- 22:01Resources and conclusion
related talks
 29mFootball (soccer) data analysis: A pedagogic introduction
 46mGraph Algorithms: Predict Real-World Behavior
 45mThe Technical Journey to Define the True Value of a Football Goal
 11mIntroduction to Soccer Pass Network Analysis with Python
 32mUnderstanding Complexly Connected Data using Graph Databases
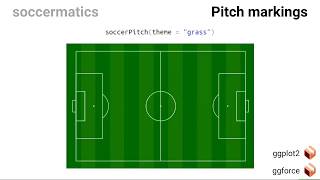 19mFootball Analytics with the Soccermatics Package
 32mCutting Edge Football Analytics in Python
 14mG-forces Meet Graphs: Analyzing 50+ Years of Formula 1 Sponsorship Using GDS