Sparking Joy for Engineers with Observability
summary
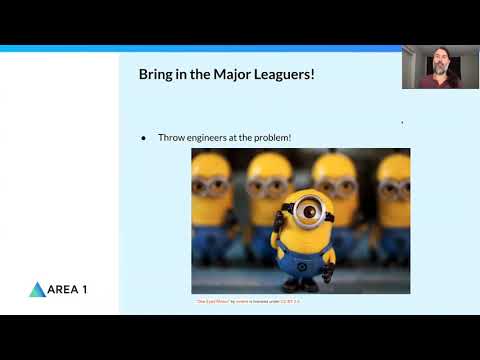
A production bug takes five days to fix before integration of exception reporting with distributed tracing; after adding a conversation header from the browser and tagging exceptions with the W3C trace id, traces show the full cross-service transaction and the missing query parameter that caused timeouts. Implementation notes: can’t start traces in-browser so propagate an ID, instrument clear transaction boundaries, attach relevant query/database metadata. Result: faster time-to-resolution and engineers spending less time wading through logs.
AI-written summary · about
chapters (8)
- 0:00Introduction
- 1:17Engineer's joy and tools
- 3:45Debugging pain in distributed systems
- 5:105-day debugging saga with VIP
- 7:59Observability speeds resolution
- 9:23Engineers' delight and adoption
- 10:27Tracing integration challenges
- 12:56Instrumentation best practices
related talks
 42mDistributed Tracing Opening the Door to Visualisation and Correlation
 51mNavigating Distributed Traces
 57mDistributed Tracing: How the Pros Debug Concurrent and Distributed Systems
 58mMessage processing failed! But what's the root cause?
 49mImproving Observability of Distributed Systems
 53mUnmask hidden issues with Observability superpowers!
 20mThe (Full)stack Trace: Understand Your App with Distributed Tracing
 39mResolving Outages Faster with Better Debugging Strategies