The (Full)stack Trace: Understand Your App with Distributed Tracing

summary
Shows that full stack distributed traces link browser activity to backend spans so you can see what actually happens and why a user sees slowness. Demonstrates wiring front end timing into backend by adding a trace ID header on HTTP requests, using a superagent plugin and Redux middleware to start/stop spans, and shipping traces to Jaeger UI. Advises batching spans instead of one HTTP call per action and points to real‑world example repos and an all‑in‑one Jaeger docker image.
AI-written summary · about
chapters (11)
- 0:00Intro
- 0:18Your users are at risk
- 1:00Its too slow
- 3:49What is a trace
- 7:51What makes up a trace
- 9:21How do we instrument our code
- 10:48Whats behind the API
- 12:08Whats in a real application
- 13:55Making the full stack
- 15:08In a full stack application
- 18:15Conclusion
related talks
 25mFollow The (Full)stack Trace: Understand Your App with Distributed Tracing
 51mNavigating Distributed Traces
 22mTracing is for Everyone, Not Just Backend Engineers. (How Tracing Could Help Front-e...
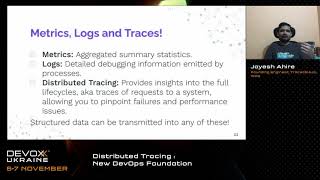 24mDistributed Tracing : New DevOps Foundation.
 22mDistributed Tracing
 57mDistributed Tracing: How the Pros Debug Concurrent and Distributed Systems
 42mDistributed Tracing Opening the Door to Visualisation and Correlation
 35mNavigating the Distributed Systems Execution Maze With OpenTracing