Identifying underlying patterns in apps data

summary
Analysis of Google Play app usage groups categories into social value, entertainment value, and goal-oriented patterns and finds nearly 20,000 apps with 100,000+ MAU. Majority of users open one app in a month; social median is two and top quartile reaches three. Goal-oriented shows 65% of users active 1–2 days per month while social has 25% active 26+ days. Subscribers show 75% higher engagement than non-subscribers, median retention from first to second monthly payment is 59% and yearly 46% and winbacks are under 20%.
AI-written summary · about
chapters (9)
- 0:00Intro
- 2:23Let's go through the percentile bands for these categories
- 6:45Understanding the use-cases by category title usage
- 12:22MAU engagement rate by days active
- 14:13Different category groupings drive different shapes
- 16:42Consider what can impact engagement for your category
- 24:20Consider how subscribing impacts engagement
- 26:36Retention rates where do you stand?
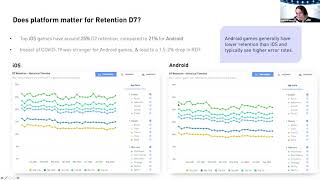
- 28:15How do you fit into the Android ecosystem?
related talks
 22mGlobal trends – Insights from 3 billion mobile gamers
 20mMaximizing monetization via cross-category affinities
 17mThe future of gaming and global trends
 29mSuperstar Session: Hypercasual Games Under the Microscope: What Happened in 2020?
 28mSuperstar Session: How to Maximise the Game Economy With Ad Monetisation – Ron Thomas
 19mState of Mobile Gaming 2022
 16mGame On or Game Over: Level Up Your Gaming Strategy
 30mSuperstar Session: How to Maximise the Game Economy With Ad Monetisation – Lexi Sydow