Analyzing HotSpot Crashes
summary
Shows how HotSpot writes hs_err_pid and replay_pid files, how unsafe memory writes and class redefinition can crash the VM, and which data actually helps root cause analysis. Demonstrates using jcmd and the HotSpot Serviceability Agent to generate vminfo, extract classes from a core, rebuild jars and replay JIT compilations, reproducing a metaspace leak that manifested as ~320 C++ class objects; uses -XX:+CrashOnOutOfMemoryError and replay options (including ignore-init-errors) to replay and debug the failure.
AI-written summary · about
chapters (10)
- 0:00Intro
- 2:01HotSpot VM Overview
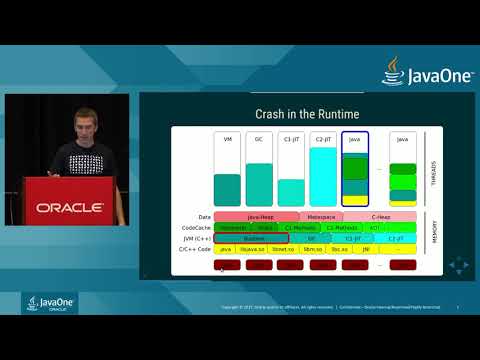
- 14:49Crash in the Runtime
- 16:52Where did we crash?
- 19:20Crash in the Interpreter
- 27:58Out of Memory - Serviceability Agent
- 32:39Crash in the Compiler
- 34:10Debugging the Crash
- 39:28Serviceability Agent - Dump Classes from Core
- 43:19Crash Location and Crash Reason
related talks
 46mA Guide to Memory Analysis for JVM Applications
 59mAn Introduction to JVM Performance
 50mEmergency Dump — The Black Box of a Crashed JVM
 32mMastering JVM Memory Troubleshooting - From OutOfMemoryErrors to Leaks
 01h 01mAn Introduction to JVM Performance
 54mJava performance techniques The cost of HotSpot runtime optimizations
 47mJVM Performance Engineering - Inside OpenJDK and the HotSpot Java Virtual Machine
 56mHotSpot Internals: Safepoints, NullPointers and StackOverflows