JVM Performance Engineering - Inside OpenJDK and the HotSpot Java Virtual Machine
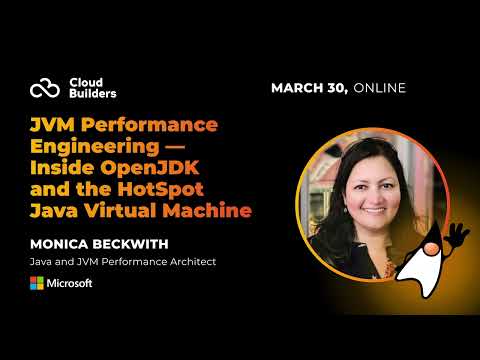
summary
Step-by-step performance process: monitor with Java Flight Recorder and OS counters, then profile slices with VisualVM, Performance Analyzer or VTune, analyze GC logs and heap dumps, and tune JVM flags and GC choice. Example: a distributed service shows min GC pauses ~7 ms, average ~320 ms and 99th ~1 s but a max pause 20s caused GC: 5 full GCs + 10 evacuation failures, which cascades into >5 minutes user-visible delay.
AI-written summary · about
chapters (25)
- 0:00Introduction
- 1:00What is software engineering
- 4:33Define an approach
- 8:01Success criteria
- 14:31Application stack
- 15:26Application ecosystem
- 16:34JVM Runtime Environment
- 18:29Operating System
- 19:14Hardware
- 20:26Known Unknowns
- 21:18Topdown Methodology
- 22:22Bottomup Methodology
- 24:11System Under Test
- 24:53Performance Monitoring
- 26:29Performance Monitoring Tools
- 26:43Monitoring Tools
- 28:12Monitoring vs Profiling
- 29:48Performance Analyzer
- 30:28Tuning
- 31:33Garbage Collectors
- 35:26Ramp Ups
- 37:18Measuring the Right Thing
- 38:16Three Things You Know
- 39:09CPU Metrics
- 41:50Memory Leaks
related talks
 59mAn Introduction to JVM Performance
 52mGC Tuning & Troubleshooting Crash Course
 56mJava Performance Analysis
 39mG1GC Concepts and Performance Tuning
 55mThe Performance Engineer's Guide To Java HotSpot
 01h 01mAn Introduction to JVM Performance
 33mChecking out JVM 12-16
 01h 28mThe dark art of performance tuning or how to become a performance hero ...