Mastering JVM Memory Troubleshooting - From OutOfMemoryErrors to Leaks

summary
Covers concrete diagnostics for Java heap, metaspace and native memory problems, with actionable steps: enable -XX:+HeapDumpOnOutOfMemoryError and Xlog:gc, collect GC logs, heap dumps and histograms via jcmd/jmap/JHSDB, analyze with MAT and JMC, and use native memory tracking (NMT) plus pmap/ps/core files to find JNI or native leaks. Shows a metaspace example rising to ~14MB then dropping to ~10MB on full GC, explains patterns (continuous growth vs spikes), and describes a RAG-based troubleshooting assistant built on OCI GenAI and LangChain that returns accurate guidance.
AI-written summary · about
chapters (19)
- 0:00Introduction
- 0:28Session agenda
- 0:52JVM memory areas
- 3:40Identifying memory problems
- 6:28Understanding OOM errors
- 8:44Memory growth and performance
- 10:53Diagnosis approaches
- 13:15Diagnostic data collection
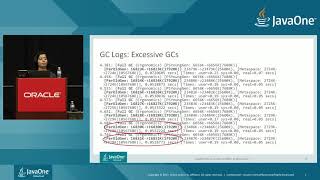
- 14:50Analyzing GC logs
- 16:40Visualizing GC data
- 20:56Collecting heap dumps
- 22:16Analyzing heap dumps
- 23:55Using heap histograms
- 24:39Java Flight Recorder
- 26:33Native memory tracking
- 27:47OS monitoring and core files
- 29:44Debugging native leaks
- 30:35AI troubleshooting assistant
- 32:00Conclusion
related talks
 43mTroubleshooting Memory Problems in Java Applications
 34mTroubleshooting Native Memory Issues in Java Applications
 02h 41mSolving Memory Leaks in the JVM
 48mJava Memory Management Best Practices
 47mManaging and monitoring a JVM
 46mA Guide to Memory Analysis for JVM Applications
 43mWho Ate My RAM?
 02h 41mCures for OOMKills, Warm-ups, and Slowness in JVM Containers