Federated Prometheus Monitoring at Scale

summary
Oath runs 12 Kubernetes clusters across multiple datacenters with ~2,000 worker nodes, ~12,000 pods and ~50,000 containers, each cluster hosting a local Prometheus (up to ~5M series / instance, 300K samples/sec aggregate) and a single federated Prometheus that scrapes aggregated metrics and control-plane endpoints. They reduce series with aggregation rules (CPU/memory summed by colo/namespace/controller), keep 1 year retention on the federated store, and use federation plus Alertmanager for severity-driven paging and dashboards.
AI-written summary · about
chapters (23)
- 0:00Intro
- 1:16Journey to Kubernetes
- 4:00Growing Kubernetes Clusters
- 4:30Demand for visibility
- 4:54Monitoring Requirements
- 5:36Prometheus 2.0
- 7:10Metrics Collection - API Server
- 8:40Metrics Proxy - ETCD
- 8:57Metrics Proxy - Controller
- 12:52Federation Configuration
- 14:03Aggregation Rules
- 14:43Aggregation - Colo level
- 16:04Aggregation - Namespace level
- 16:23Aggregation - Controller level
- 16:34Aggregation - Pod level
- 17:01Alert Manager
- 17:56Alert Rules
- 22:12Cluster Stats
- 22:30Cluster View
- 23:36Deployment
- 24:41Scheduler
- 25:54Package version
- 26:14Volume of the metrics
related talks
 29mParanoid Observability –Success Stories and Misfortunes observing an observability stack
 29m“If you Don’t Monitor your Infrastructure, you Don’t Own it!” Regain Control Thanks to Prometheus
 24mBanking Observability at Scale
 24mCost-Efficient Multi-Cluster Monitoring with Prometheus, Grafana & Linkerd
 39mHow To Take Prometheus Planet Scale: Massively Large Scale Metrics Installations
 31mPCF Platform Monitoring with Prometheus and Grafana
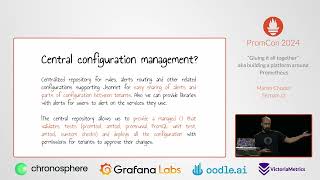 32m“Gluing it all together” aka building a platform around Prometheus
 18mArchitecting Growth: Scaling Tactics for Prometheus Metrics...