Through the looking glass: Effective observability for cloud native applications
summary
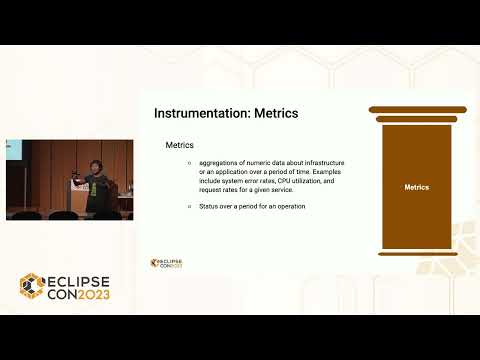
Cloud-native apps produce logs, metrics and distributed traces; the page shows a working example where one request generates a single trace with five spans across two services (inventory → system) and timestamps/durations recorded. It uses OpenTelemetry for API/SDK/collector, MicroProfile Telemetry (adopting OpenTelemetry tracing) with automatic/manual/agent instrumentation, and the OTel Java agent option; metrics (CPU, heap, request counts) and traces successfully correlate via trace IDs.
AI-written summary · about
chapters (14)
- 0:00Cloud native observability intro
- 1:08Why cloud apps need observability
- 3:35Defining observability
- 5:45Three pillars of instrumentation
- 8:15Distributed tracing in microservices
- 10:48Spans and traces complete picture
- 13:20OpenTelemetry standard
- 17:57MicroProfile telemetry
- 21:09MicroProfile Telemetry 1.1
- 23:23Manual vs automatic instrumentation
- 27:17Storing observability data
- 29:05Live demo with MicroProfile
- 35:32Observability resources
- 36:16Q&A
related talks
 47mThrough the Looking Glass: Effective Observability for Cloud-Native Applications
 47mUsing metric and traces to diagnose our cloud-native applications
 55mCloud-Native Observability with OpenTelemetry
 58mThrough the looking glass: Effective observability for cloud native applications
 27mEnd-to-end visibility in the cloud w/OpenTelemetry
 32mDistributed Tracing in Action: Our Journey with OpenTelemetry
 50mBecoming a cloud-native physician: Using metric and traces to diagnose applications
 16mThe State of Observability