Linux Server Deep Dives

summary
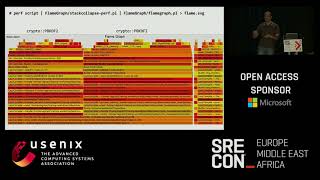
Live demos show perf_events and eBPF (BCC) tracing real Drupal workloads on a tiny 1 GB VM, requiring root and debug symbols and sometimes rebuilt services (mysqld/PHP). Examples: perf stat shows drush status triggers ~7,000 file syscalls, 3 net connects, 21 sends, 72 receives and 12 execs, tools used include perf trace/top/record, tcpconnect/tcptracer, stat_snoop, filetop, bitsize, ext4/XFS histograms, cachestat/dcostat, pitpersec, tty snoop and ssl_sniff; perf adds moderate overhead while strace is orders of magnitude slower.
AI-written summary · about
chapters (17)
- 0:00Intro
- 0:39WARNING: This is NOT Your Usual Linux Talk
- 1:05Goal: An Introduction to Advanced Tooling
- 4:00The Extended Berkeley Packet Filter (eBPF)
- 4:35What Does This Mean For eBPF?
- 4:53Installing BCC
- 8:09perf trace overhead
- 10:22perf record
- 11:49perf top
- 13:06Dynamic Tracing with 'perf probe
- 14:58Trace HTTP Requests in Real Time
- 16:58Trace File Accesses On Web Server
- 21:15How Long Does it Take For Filesystem Operations?
- 26:40Trace Creation of New Processes
- 31:33Spy On All User Sessions!
- 34:15In Summary
- 34:47Further Reading
related talks
 51mLinux Systems Performance - Architecture
 32mListen to your Engine
 11mFinding out what's really going on, with DTrace!
 44mMonitor Your PHP Applications with Logs, Metrics, Pings, and Traces
 45mPerformance lab. The power of the perf tool!
 29mProfiling Node Applications
 41mLinux Systems Performance
 31mFantastic tracepoints and where to find them