Observe your API with an API Gateway Plugin

summary
Demonstrates using Apache APISIX plugins to get logs, metrics and traces without changing app code: a Docker Compose demo wires APISIX, a .NET product API (two demo products), Prometheus, Zipkin/Jaeger and Grafana; the HTTP logger posts request records to a mock log endpoint and the Prometheus plugin exposes /prometheus metrics that Grafana dashboards display (requests/sec, latency). Setup runs from the repo and claims full observability in under five minutes.
AI-written summary · about
chapters (14)
- 0:00Introduction
- 1:46What is API observability
- 4:18Why API observability matters
- 7:49What is an API Gateway
- 8:10Plugins in API Gateway
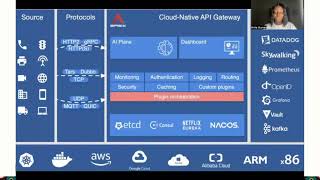
- 9:59Introducing API6 project
- 11:50Three pillars of observability
- 14:59Demo setup prerequisites
- 16:26Enabling logging with API6
- 23:14Configuring API Gateway routes
- 24:20Collecting metrics with Prometheus
- 26:53Visualizing metrics in Grafana
- 28:39Key takeaways
- 30:30Q&A
related talks
 35mObserve your API with API Gateway Plugins
 35mAPISIX, an API Gateway the Apache way
 01h 18mStarting Apache APISIX on the right foot
 26mImplementing a DevOps-friendly API Architecture with Apache APISIX
 22mBuilding Reliable APIs with Apache APISIX
 35mEvolving your APIs, a step-by-step approach
 49mEvolving your APIs, a step by step approach
 23mPractice of Apache APISIX in Low-Code Gateway