Observe your API with API Gateway Plugins

summary
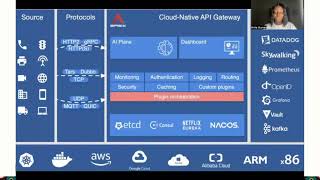
Demonstrates using Apache APISIX as the observability hub by wiring real plugins to an ASP.NET Core backend running in Docker Compose: HTTP logger sends request JSON to mockbin, Prometheus exposes /apisix/prometheus/metrics for Grafana, and Zipkin plugin reports traces visible in Zipkin UI. Shows creating upstreams and routes via APISIX admin API, enabling multiple plugins together, and confirms logs, metrics and traces are collected end-to-end. Also notes custom plugins can be written in Java, Go, Python or JavaScript.
AI-written summary · about
chapters (26)
- 0:00intro
- 0:21preface
- 0:31about me
- 0:51agenda
- 2:10apis are everywhere
- 2:37even chatgpt uses apis
- 2:50performance, availability, integrity
- 4:46what is api observability?
- 5:32tracing, logging, metrics
- 5:46api observability is a part of every api development
- 7:17api gateway
- 7:44a central point for api observation
- 7:56api gateway plugins
- 9:15what is apache apisix?
- 9:47custom plugin development
- 10:57observability...
- 11:23logging
- 12:25logger plugins
- 13:10http logger plugin
- 13:37metrics
- 14:28prometheus plugin
- 14:53tracing
- 15:27zipkin plugin
- 16:09observe asp.net core web api with apisix - demo
- 34:30takeaways
- 34:58thank you
related talks
 35mObserve your API with an API Gateway Plugin
 35mAPISIX, an API Gateway the Apache way
 01h 18mStarting Apache APISIX on the right foot
 26mImplementing a DevOps-friendly API Architecture with Apache APISIX
 22mBuilding Reliable APIs with Apache APISIX
 28mWhy is API Gateway essential to business
 23mPractice of Apache APISIX in Low-Code Gateway
 35mEvolving your APIs, a step-by-step approach