Set Your Code on Fire with FlameGraphs
summary
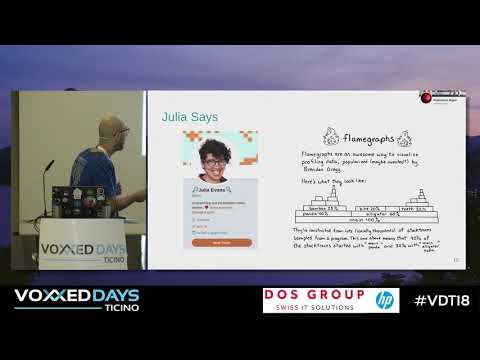
FlameGraphs are used to visualize sampled JVM stacks to show where execution time actually goes, not just which methods are named. The talk explains why sampling is better than instrumentation for production but warns that JVM safepoints pause all threads and can distort profiling, and how HotSpot optimizations (inlining, loop-specialization) can make hot methods disappear or reappear. It advocates using native samplers (perf) or async-profiler with perf to capture both native and Java frames so FlameGraphs reveal true mixed-mode hotspots and real bottlenecks.
AI-written summary · about
chapters (11)
- 0:00Introduction
- 3:26What profilers are and limits
- 10:45Traditional Java profiler limits
- 15:05Why methods disappear
- 20:45JVM safepoints mechanism
- 26:53JVM optimizations impact
- 33:02Traditional profilers inlining issues
- 38:27Sampling observer effect issues
- 41:41Java profiler overview
- 44:52FlameGraph native profilers
- 47:42Async Profiler hybrid solution
related talks
 46mCPU Profiling on the JVM and Flame Graphs
 32mJavaflame - Capture function arguments, visualize them in a flamegraph
 33mWriting a Java Profiler in Pure Java
 45mHow difficult can it be to write efficient code?
 59mAn Introduction to JVM Performance
 45mProfiling the HotSpot JVM Using eBPF
 41mAn Introduction to JVM Performance
 46mHow difficult can it be to write efficient code?