How difficult can it be to write efficient code?

summary
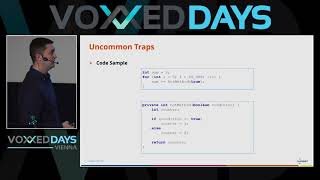
Shows how to find and fix real Java hotspots using AsyncProfiler and flame graphs to locate cost, then JMH microbenchmarks to measure fixes. Demonstrates a case where naive StringBuilder made things slower, a specialized equals/hashCode object cuts allocations and yields about a 50% throughput improvement, and startup latency drops from ~25 ms to ~17 ms after string‑matching redesign. Live demos include JVM sampling, JFR export, iterative rebuilds and surprising numbers that turn opinion into measurable results.
AI-written summary · about
chapters (13)
- 0:00Introduction to performance
- 2:13Premature optimization myth
- 3:37Measuring code performance
- 6:13Introduction to async profiler
- 9:13Practical code optimization
- 13:42Using JMH for benchmarks
- 17:08Benchmarking and refining solutions
- 23:15Analyzing optimization results
- 27:06Is optimization worth it?
- 28:53Real-world configuration matching
- 37:46Maintaining performance over time
- 40:36The billion row challenge
- 41:57Conclusion and key takeaways
related talks
 46mHow difficult can it be to write efficient code?
 38mMemory Efficient Java
 54mJava performance techniques The cost of HotSpot runtime optimizations
 59mAn Introduction to JVM Performance
 51mJava at Speed: Getting the Most Out of Modern Hardware
 41mUnleash the Power of Open-Source Java Profilers
 33mWriting a Java Profiler in Pure Java
 50mSet Your Code on Fire with FlameGraphs