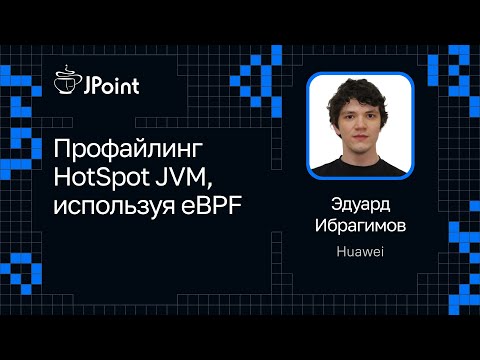
Profiling the HotSpot JVM Using eBPF
summary
Shows how to build a JVM profiler that collects runtime information and produces flame graphs by using eBPF (Linux extended Berkeley Packet Filter) instead of the JVM TI interface. Covers using eBPF to observe HotSpot JVM execution and gather profiling data for performance optimization of Java applications.
AI-written summary · about
chapters (14)
- 0:00Introduction
- 1:33What is eBPF
- 3:00Java profiling issues
- 8:02eBPF basics
- 10:51How eBPF profiler works
- 14:51Running eBPF code
- 17:19Naive profiling approach
- 18:45eBPF kernel limits
- 21:59Profiler architecture
- 22:40Comparison with profilers
- 23:23eBPF development challenges
- 28:19Kernel version issues
- 30:45Why eBPF profiler
- 33:17Q&A
related talks
 46mCPU Profiling on the JVM and Flame Graphs
 01h 07meBPF: Fueling New Flame Graphs & more
 27mLow-Overhead Tracing Using eBPF for Observability into Kubernetes Apps and Services
 50mSet Your Code on Fire with FlameGraphs
 36mObservability and performance analysis with BPF
 24meBPF Application Instrumentation for Java: Challenges, Design, and Real...
 59mAn Introduction to JVM Performance
 40mhello-ebpf: Writing eBPF Programs Directly in Java