Applying Statistical Modeling & Machine Learning to Perform Time-Series Forecasting

summary
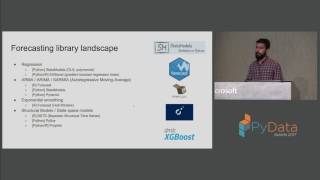
Walks through a reproducible notebook that ingests a 23 MB CSV (1.2M rows), aggregates to daily counts (408 listings on the last date), and shows that raw series fails the Dickey‑Fuller (p≈0.3) but log + differencing and rolling weekly averages achieve stationarity. Implements and compares ARIMA (various p,d,q), Facebook profit with forecast intervals, and an LSTM (trained for a few epochs) and reports RMSEs, practical preprocessing steps, and which pipelines actually produce usable forecasts.
AI-written summary · about
chapters (10)
- 0:00Time series forecasting intro
- 10:05Data due diligence
- 23:33Analysis environment setup
- 30:15Exploring time series data
- 40:47Achieving stationarity
- 58:27ARIMA and related methods
- 1:06:02Facebook Prophet for forecasting
- 1:10:41LSTM for time series
- 1:18:16Key takeaways
- 1:25:00Q&A
related talks
 25mTimeSeries Forecasting with ML Algorithms and there comparisons
 42mRobust Automated Forecasting in Python and R
 29mTime Series Forecasting Techniques in Python
 01h 43m(Serious) Time for Time Series
 43mFeature Engineering for Time Series Forecasting
 45mForecasting at Scale
 01h 18m(Serious) Time for Time Series
 24mMachine learning and financial time series analysis