Build a web app in Python
summary
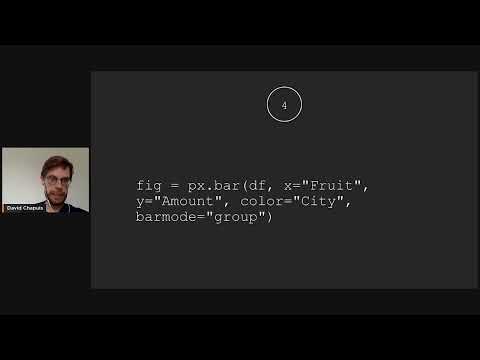
Creates a tiny web app using Dash, loads data into a pandas DataFrame built from three dictionaries, and draws a grouped bar chart comparing fruit amounts in San Francisco and Montreal with product Express (PX) called as px.bar. Layout uses HTML and core components to embed the figure. App runs on the Flask dev server with debug=True so the dashboard appears at a local URL. Example has no interactivity but the chart displays successfully.
AI-written summary · about
related talks
 41mDash: data exploration web apps in pure Python
 29mUsing Dash by Plotly for Interactive Visualisation of Crime Data
 31mUsing Dash to Create Interactive Web Apps for Non-Technical Audiences
 33mIntro to Dash
 01h 26mPanel: Dashboards for PyData
 22mIntro to Plotly Dash
 26mDeveloping Dashboard Applications using Bokeh
 30mMeta-Dashboards: Accelerating Geospatial Web Apps Creation with Voilà