Data Storytelling through Visualization
summary
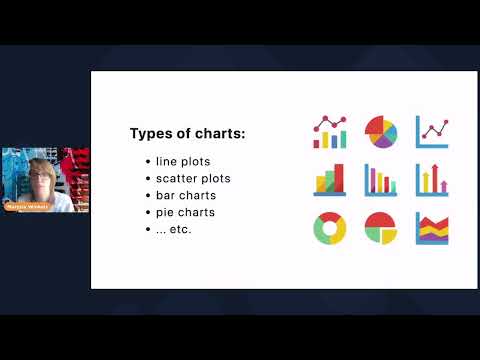
Argues that visualization must move from analysis to action and demonstrates concrete choices that change conclusions: used basic matplotlib and mentions Altair and Plotly, shows Anscombe / same stats different graphs to prove visualizing matters, and contrasts an Iraq deaths-per-month chart (2004–2011) with a redesigned bar chart that flips the implied message. Recommends active titles and three visual elements to guide focus, warns against omitting ranges or data, and advocates active titles like "we need…" to force an action-oriented takeaway.
AI-written summary · about
chapters (9)
- 0:00Data storytelling intro
- 1:53Why visualize data
- 5:29Exploratory vs explanatory
- 8:39Effective data story foundations
- 15:20Choosing data carefully
- 15:40Guiding focus with design
- 20:38Defining audience takeaway
- 23:05Summary
- 24:08Answering audience questions
related talks
 31mData Storytelling through Visualization
 11mData Visualization & Storytelling
 24mStorytelling with data
 38mThe Art of Telling Stories with Data
 20mearn to make the point: data visualisation strategy
 40mData Visualization for Humans
 21mTurn Data into Action: How visualization aids decision intelligence
 14mStorytelling in the Age of Big Data