Embracing multi-lingual data science

summary
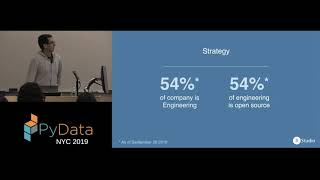
Posit renames RStudio and ships concrete multilingual tooling: tidyverse code uses dplyr and ggplot2 to process 300,000 rows of flight data, computing speed, grouping routes, filtering to routes with ≥10 flights and revealing a curved distance–speed pattern plus outliers (non‑continental airports). R’s surprising features—first‑class ASTs and environments and methods bound to functions—notes why dbplyr compiles dplyr to SQL. Open projects include quarto for multi‑language publishing, shiny for interactive apps, and vetiver for versioned model deployment (Docker + JSON APIs).
AI-written summary · about
chapters (10)
- 0:00Multi-lingual data science intro
- 1:11R language surprises
- 10:00R AST and environments
- 17:44R pipelines methods
- 21:16CRAN package management
- 26:29RStudio to Posit tools
- 31:08Quarto multi-language docs
- 38:33Shiny Python R dashboards
- 43:08Vetiver ML Ops workflows
- 47:22Q&A
related talks
 21mNew language features in RStudio
 35mEffective Python and R collaboration
 01h 01m50 ways to show your data
 21mWhen R Met Python: A Meet Cute on Posit Connect
 01h 25mIntroduction to Data Manipulation and Visualizations in R
 17mPolyglot Data Science: Why and How to Combine R and Python
 37mRewriting your R analysis code in Python
 18mYes, you can use Python with RStudio Team!