Prometheus 101

summary
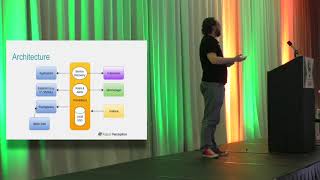
Prometheus is a pull-based time-series DB that scrapes plain‑text HTTP endpoints exposed by services and Kubernetes, stores 64‑bit numeric samples, and adds Kubernetes labels for slicing. Core types covered are counter, gauge, histogram, summary and the demo uses a messages_processed counter shown via curl and the Prometheus UI. Querying uses PromQL with functions like rate() handles counter resets; Alertmanager consumes PromQL rules and dashboards are typically built with Grafana.
AI-written summary · about
chapters (8)
- 0:00Intro
- 1:50About Prometheus
- 2:45Prometheus Architecture
- 4:07Prometheus Metrics
- 6:37Types of Metrics
- 13:18Prometheus Query Names
- 14:00Metrics
- 15:11Alerting