Data magic with the Elastic stack!
summary
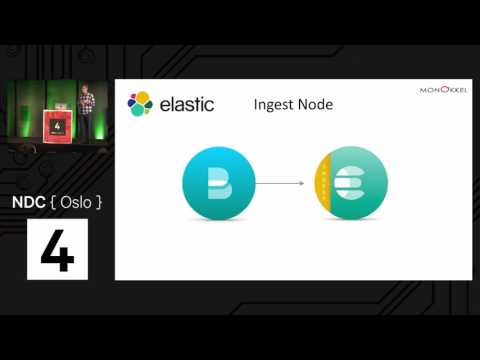
Elastic Stack 5.x/6 alpha demos show concrete features: using ingest node and reindex API to transform and repair indexes without returning to source, beats for lightweight ingestion, and Kibana’s visual builder with pipeline aggregations to compute cumulative sums, moving averages and annotate anomalies. Examples analyze NYC traffic (detecting major accident spikes) and AIS ship positions (tracking port calls, waiting days and predicting arrivals); dashboards and exports work live and reveal actionable, production-grade insights.
AI-written summary · about
chapters (16)
- 0:00Start
- 7:05Elastic Stack
- 9:39Alerting
- 12:50Ingest Node
- 14:00Re-Index Api
- 16:06Introduction to the Syntax
- 20:46Pipeline Aggregations
- 25:36Date Histogram
- 32:18The Visual Builder
- 34:22Calculate the Cumulative Sum
- 34:43Secondary Axis
- 35:06Add Annotations to Our Data
- 35:54Annotations
- 42:31Results
- 45:51Live Demo
- 51:21Coordinate Map
related talks
 41mBetter Data Exploration and Visualisation with Elasticsearch and Kibana
 42mMake Sense of your (BIG) data!
 39mHandling, extending and presenting data with ELK+
 48mDeeper Data Dimensions with Kibana
 45mProfessional Data: Using Elasticsearch's Aggregation Framework
 44mElastic Stack: The analyst's secret weapon in the fight against insurance fraud
 01h 35mThe Modern Data Stack
 35mEnriching Postal Addresses With Elastic Stack