Understanding Learner Behavior Through Learning Design Informed Learning Analytics

summary
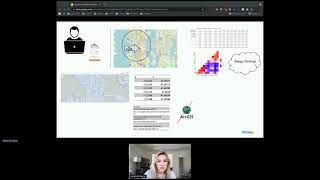
A learning‑design‑aware analysis of an edX Python MOOC codes videos and exercises with a revised Bloom taxonomy, builds a learner resource access transition matrix and shows it as a heat map visualization, and uses SNA degree counts to rank resource roles. The transition matrix produces a diagonal (sequence following) plus mirror‑image clusters (review/resume events). Overview and summary videos surface as frequent triggers and targets. Higher‑education and higher‑skill completers show higher in/out degree to complex problem sets; prior programming experience has little effect.
AI-written summary · about
chapters (4)
- 0:00Start
- 0:49More meaningful feedback needs learning design perspectives, which is yet to be investigated. "Learning analytics needs to build on and better connect with the existing body of research knowledge about learning and teaching" (Gaševic, D. Dawson, S. & Siemens, 2015)
- 1:44Learning resource access transitions: the learning behavior to understand A transition is a sequence of connected resource traversals each starting from a trigger leading to a target. • A learning trajectory is the path along which learning may proceed and consists of a sequence of transitions. • Learners can decide their own learning trajectories in MOOCs.
- 6:07Social Network Analysis (SNA) . We adopt the notion of degree from SNA to analyze the trigger and target resources. • In-degree represents the number of transitions going to a resource, while out degree shows the number of transitions leaving from a resource.
related talks
 03mStruggling to Detect Struggle in Students Playing a Science Exploration Game
 06mUnderstanding Player Patterns by Combining Knowledge-Based Data Abstraction with Interactive ...
 02h 03mVisualize, Analyze, and Explore: Learn Neo4j Bloom
 21mRemixing Design with Data
 21mSupporting Social Good Through Community-Based Data Science Education
 24mWhat and Why, How to Leverage Data Science and Research
 43mWhat data and design can learn from each other
 30mDebugging and Optimizing User Experience with Deep Visual Analytics