gnuplot – A Picture Says More Than 1000 Numbers …
summary
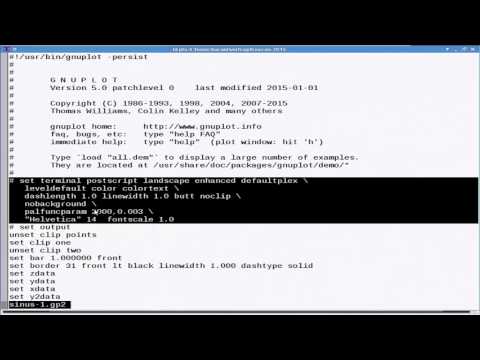
Demonstrates concrete gnuplot workflows for fetching fuel‑price HTML from spritpreis‑monitor.de, parsing it into CSV, and using set timefmt to parse times. Shows plotting about 650 gas stations (~6,000 measurements) to reveal nightly price shifts, choosing lines vs steps (and why steps can mislead), using column selection, filters and arithmetic expressions, and producing scripted, reproducible outputs (PDF/PS/PNG and reusable savefiles); also notes the change in gnuplot v5 color sequence.
AI-written summary · about
chapters (9)
- 0:00Introduction to gnuplot
- 12:27Installing gnuplot
- 23:23First steps
- 36:59Plotting data files
- 50:13Advanced data processing
- 1:05:23Exporting graphics
- 1:27:313D plots and analysis
- 1:46:44Practical tips
- 2:00:50Summary and Q&A
related talks
 01h 37mgnuplot #2: Data Analysis
 34mPractical Techniques for Polished Visuals with Plotnine
 01h 55mUse your data to tell stories
 01h 51mData Visualization and Exploration with Python
 01h 01m50 ways to show your data
 12mGraphite: A Library for Data Visualization
 18mData Visualisation with Ruby
 30mSeeing the needle AND the haystack: single-datapoint selection for billion-poin...