Instrument Your Java Applications with OpenTelemetry!
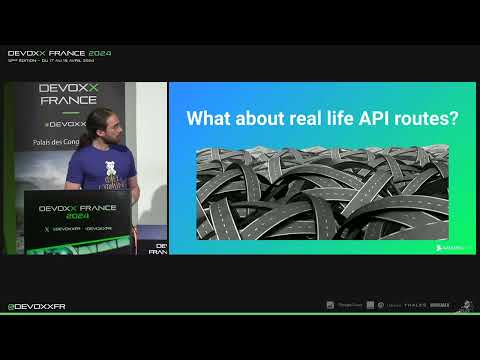
summary
Shows how to produce end-to-end OpenTelemetry traces from Java applications using three approaches: manual SDK instrumentation for full control, Spring Boot starter integration for quick framework hooks, or the JVM auto-instrumentation agent (≈100 built-in integrations) for the most complete traces. Covers exporting spans via OTLP to an OpenTelemetry Collector, W3C tracecontext/traceparent propagation for correlating spans across services, autoconfiguration through about 80 environment variables, and trade-offs (SDK = max control, starters = fast integration, agent = richest traces but possible JVM-agent conflicts and limited support for native images like Quarkus).
AI-written summary · about
chapters (10)
- 0:00Introduction
- 1:07What is OpenTelemetry?
- 4:59Demo: Traces with Java
- 11:17Auto-configuration
- 13:04Framework instrumentation
- 18:22Distributed context propagation
- 20:53Automatic JVM agent
- 22:36Instrumentation methods compared
- 25:47Conclusion
- 26:54Q&A
related talks
 49mDistributed Tracing in Java? OpenTelemetry for the Rescue!
 37mMake your Java application observable with no code changes using OpenTelemetry
 30mPractical introduction to OpenTelemetry Tracing
 38mPractical introduction to OpenTelemetry tracing
 45mPractical introduction to OpenTelemetry tracing
 41mPractical introduction to OpenTelemetry tracing
 32mOpenTelemetry feat. logs, metrics and traces
 51mPractical introduction to OpenTelemetry tracing