A hitchhikers guide to observe (Java) applications in Kubernetes

summary
Compares concrete tools and trade-offs: cluster-level kubectl/Octant/K9s give low-overhead status and kubectl debug can attach a helper container; Prometheus + Grafana act as the metric backbone; service mesh (sidecar proxies visualized by Kiali) gives request flows but not method-level details; eBPF at node level (Cilium/Hubble, Pixie) captures network telemetry with fewer hops; application-level tracing uses the OpenTelemetry collector plus a Java agent (OTLP) to show method-level spans and attributes — demos trace a slow request to a single method.
AI-written summary · about
chapters (7)
- 0:00Introduction
- 3:25Observability levels
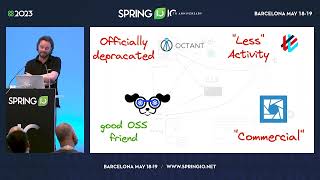
- 8:53Kubernetes API monitoring
- 16:04Pod-based observability
- 22:24Node-level observability
- 30:49Application-level tracing
- 42:10Conclusion and resources
related talks
 40mA hitchhikers guide to observe (Java) applications in Kubernetes
 43mA Guide to Observability for Your (Java) Apps in K8s
 01h 29mTutorial: A Hitchhiker's Guide to CNCF/OSS Observability So...
 45mFrom k9s to OpenTelemetry: A guide to observability for your apps in K8s
 36mWhat's going on in my cluster?
 48mFrom k9s to OpenTelemetry:A guide to observability for your Spring apps in K8s
 16mPeeking Under the Hood: Observability of Kubernetes gRPC Internals
 46mObservability Ecosystem in Kubernetes